
 Engineering

 MBSE
MBSE

To the uninitiated, the Indy 500 seems like a simple event. 200 laps (500 miles) around the Indianapolis Motor Speedway, a 2.5 mile long banked oval circuit using single-seater, open wheel IndyCars. Sounds simple enough, doesn’t it?
Well… it isn’t. As with any top level Motorsport, drivers straddle the edge of adhesion, 4 rubber tyres preventing a hard, 220+ mph rendezvous with the outside retaining wall. Cars trimmed of downforce to be as quick through the air as possible. No large tarmac run-off areas to be found on an oval. It’s a colossal challenge, easily earning the moniker “The greatest spectacle in racing”.
In 2018, the annual instalment of the Indy 500 was marked by a usually high number of crashes. Whilst it is expected that some drivers will exceed the physical limit during the heat of competition, crashing accordingly, last year featured 6 separate single car incidents. Notable drivers such as Danica Patrick, Ed Jones and JR Hildebrand, former F1 driver/ChampCar champion Sebastian Bourdais and former Indy 500 winners Tony Kanaan and Helio Castroneves all found the wall in single car incidents where they lost control of their machines in similar instances.
The talk after the event often surrounded the near record race-day temperatures of 91F/32.8C. But what effect did that have on the cars themselves? I decided to investigate using Dymola and the Claytex VeSyMA suite (VeSyMA – Suspensions and VeSyMA – Motorsports).
Building a track and vehicle model
To build a representative simulation, some form of data is required. I was lucky enough to stumble upon an article written in the lead up to the 2018 race, detailing the challenges the Indy 500 competitor faces from the cockpit. It came complete with the following data picture:
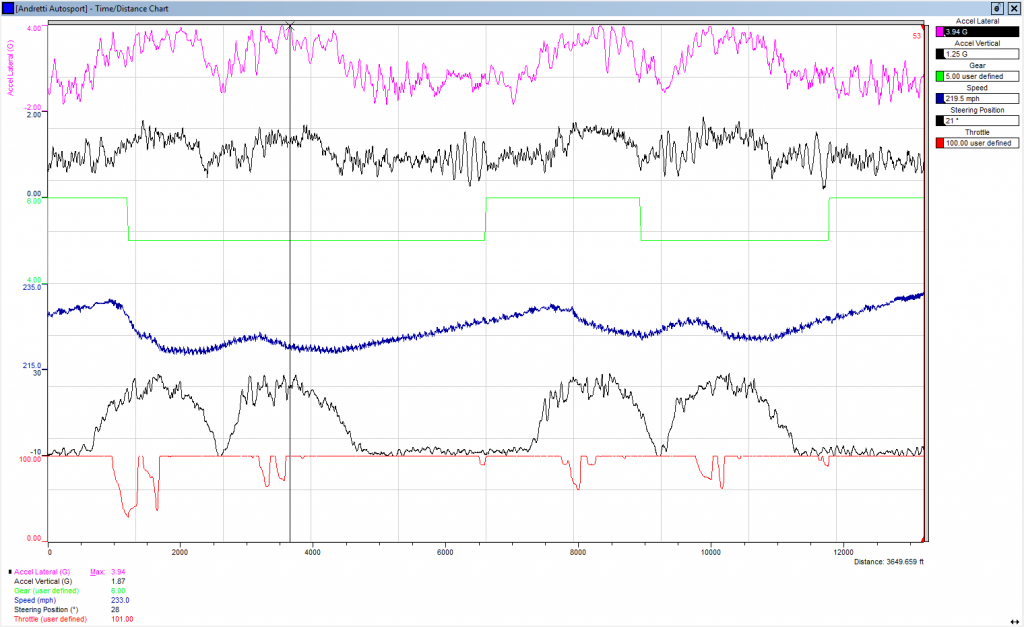
Containing longitudinal and lateral acceleration, gear, velocity, steering and throttle traces from a single, this sheet enabled me to build a reasonably representative simulation of an Indy 500 lap, utilising the IndyCar example vehicle model found in the VeSyMA – Motorsport library. A free MatLab tool known as GRABIT was used to harvest data representations from the traces in the figure. Whilst this example is not accurate enough for a qualitative judgement, we can still use it to highlight interesting trends and observe some effects.
Specifically for track generation, the lateral acceleration and longitudinal velocity traces were of immediate interest, as they can be used to calculate the radius of curvature of the vehicle path.
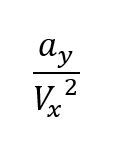
Using the radius of curvature, which is an inverse of the cornering radius of the vehicle, a road model from the actual line taken by the vehicle can be generated. This is using the Suspensions.Roads.RoadBuildingFunctions.RoadFromCurvature road building function. An option to include the banking angle is present in the function. If the data sheet above also contained the vertical acceleration, then this could be used to calculate the banking angle the vehicle experienced using the Suspensions.Roads.Functions.GPS.CalculateBankingAngle function. This function is presented in an academic paper previously published by Claytex.
Alas, the data sheet does not include vertical acceleration, therefore for the purposes of this blog post I estimated the banking angle around the turns. I assumed the banking was at the peak of 9 degrees at the middle of the turn, decaying to 0 degrees by the entry/exit. Corner apex, entry and exit points were estimated from the lateral acceleration trace.

.jpg?width=500&name=What%20is%20GD&T).jpg)