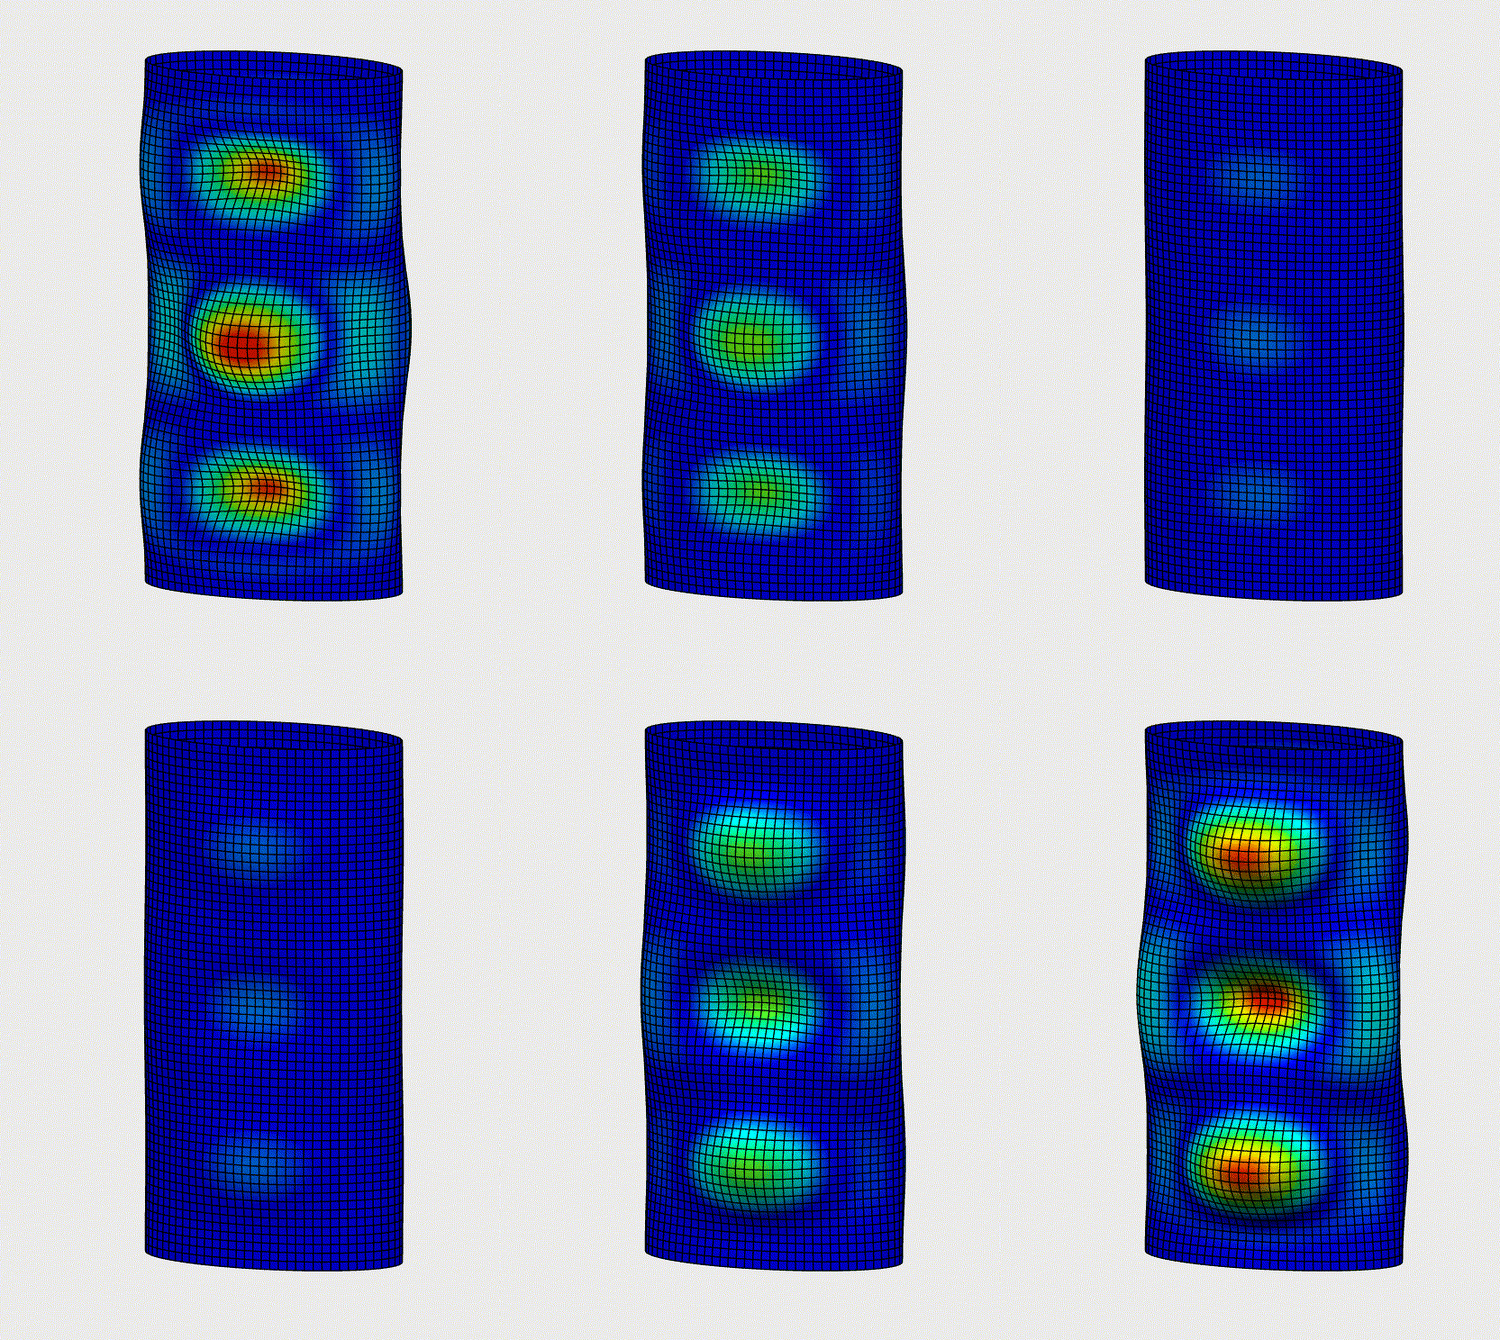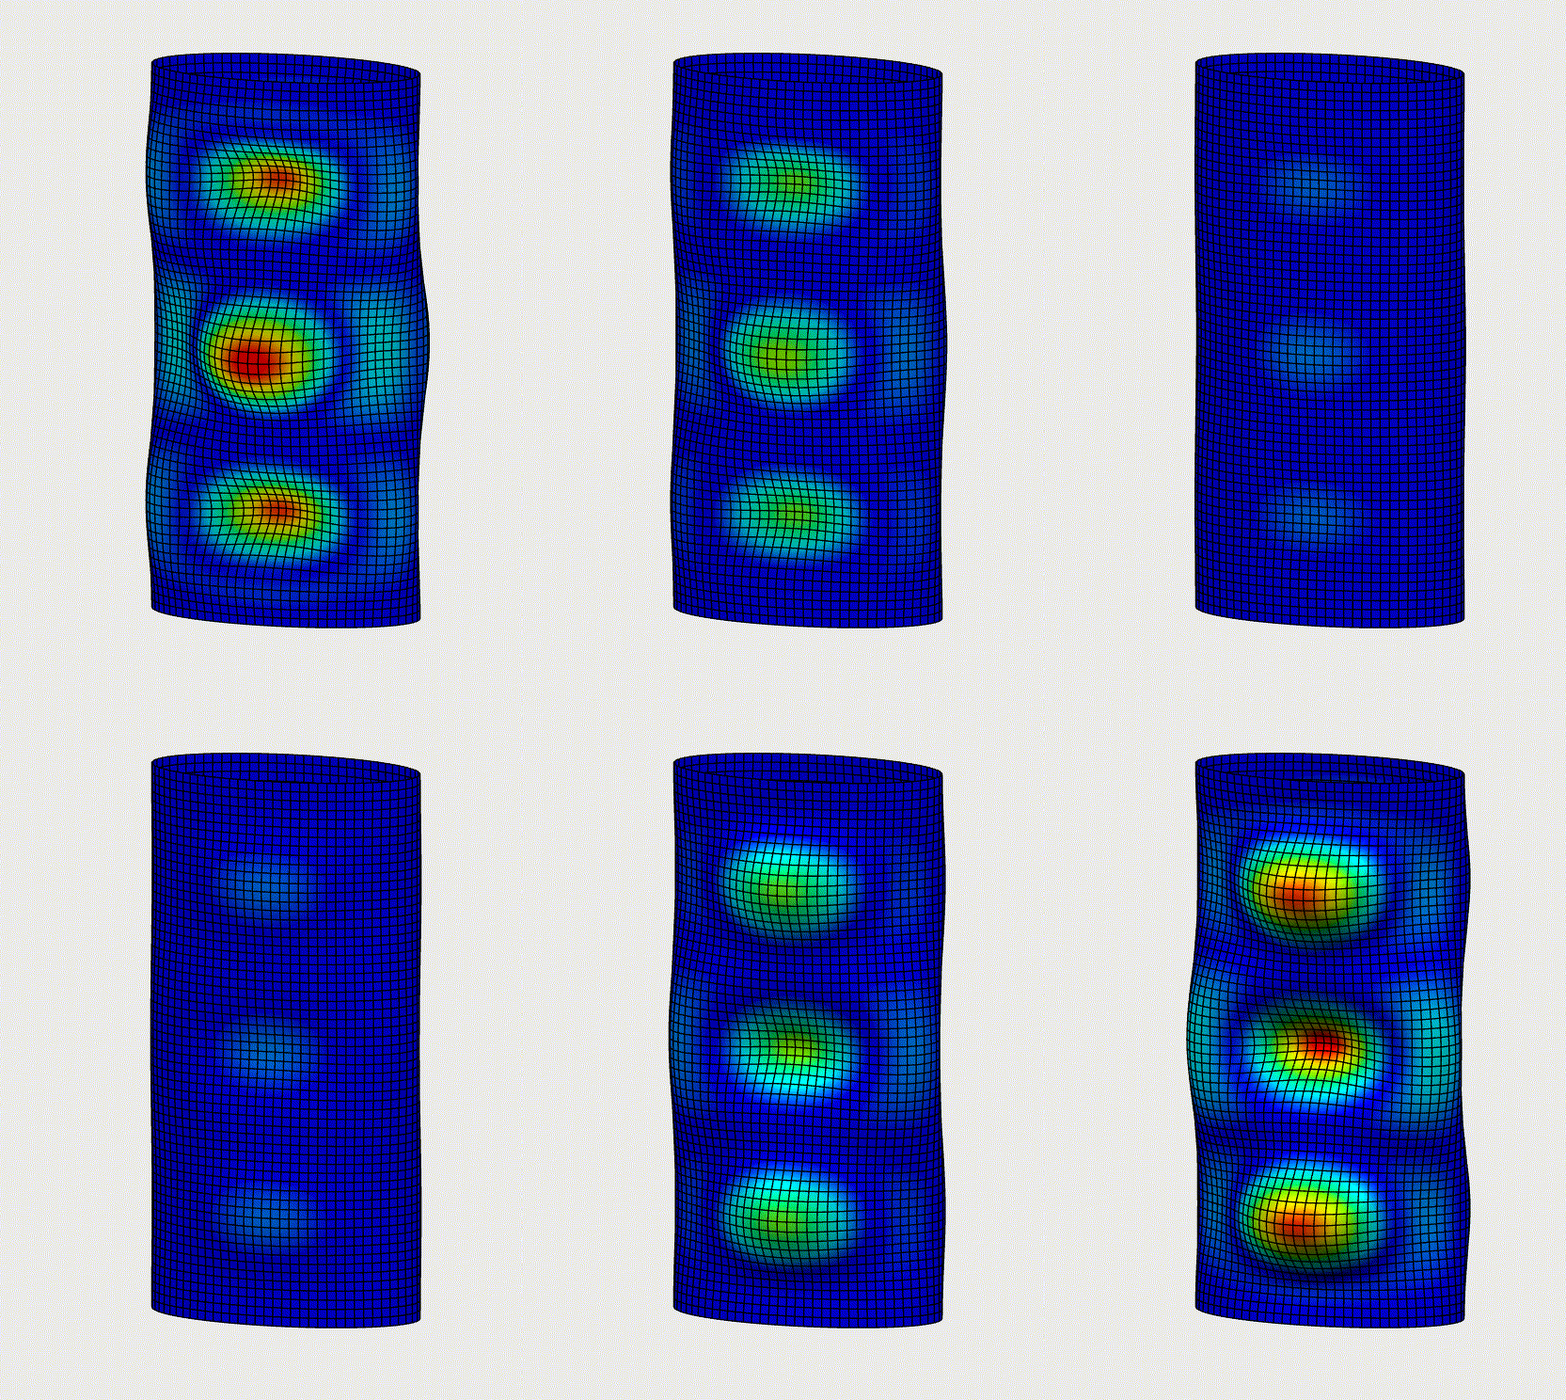
This blog post demonstrates the complete workflow for performing a nonlinear buckling analysis of an elliptical hollow section (EHS) column in 3DEXPERIENCE. The workflow combines an eigenvalue buckling analysis with a subsequent Static Riks analysis to capture both the onset of buckling and the post-buckling response of an imperfection-sensitive structure.
This blog post is intended for engineers and analysts who are:
- New to 3DEXPERIENCE
- Transitioning from Abaqus/CAE to the 3DEXPERIENCE platform
Overview
A structure's behavior under loading is usually studied with the use of load-displacement plots. We are going to analyze the buckling response of a short elliptical hollow steel column subjected to axial compression and imperfection. The analysis is carried out in two stages: an eigenvalue buckling step that identifies the likely buckling mode shape, followed by a nonlinear Static Riks step that reuses this mode shape as a geometric imperfection to trace the post-buckling response.
Geometry & Boundary Conditions
- Length: 300 mm
- Shell thickness: 4 mm
- Element: 4-node quadrilateral shell elements with reduced integration. (S4R)
- Boundary conditions:
- One end is fully clamped
- The other end is subjected to a concentrated axial load
Material Properties
The shell column material is modelled as elastic–plastic steel in the Material Definition app.
Elastic Properties
- Young’s modulus: 210,000 MPa
- Poisson’s ratio: 0.3
Plastic Properties
Plastic data is given as true stress versus true plastic strain to accurately model nonlinear material hardening and large deformations in simulations.
- Yield stress: 373 MPa at plastic strain = 0
- Hardening point: 514 MPa at plastic strain = 0.18
Modeling Workflow in 3DEXPERIENCE
1. Geometry Creation
Using Generative Shape Design app, a hollow elliptical sketch is created and extruded along its axis:
- Ellipse Major axis: 150 mm
- Ellipse Minor axis: 75 mm
- Extrusion length: 300 mm
2. Coupling & Reference Points
Two reference points are created: one below shell’s bottom edge and one above shell’s top edge. Each edge will be kinematically coupled to its corresponding reference point. This ensures uniform deformation across the cross-section and gives precise control over the boundary conditions and loads applied at each end.
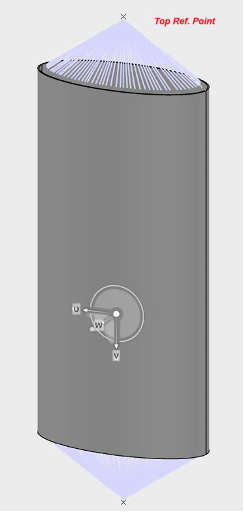
Figure 1- Reference points kinematically coupled to the column ends
3. Meshing
The FE model was created using the Structural Model Creation app, with the shell column meshed using shell elements. The shell thickness direction was defined with respect to outer surface of the shell. The elastic–plastic steel properties defined above were assigned to the shell section, with a thickness of 4 mm applied inward from the reference surface. An element size of 5 mm was selected based on a brief mesh-convergence study.
- Mesh type: Surface quadrilateral shell elements
- Element size: 5 mm
- Shell formulation: Reduced integration (S4R)
- Shell Thickness: 4 mm
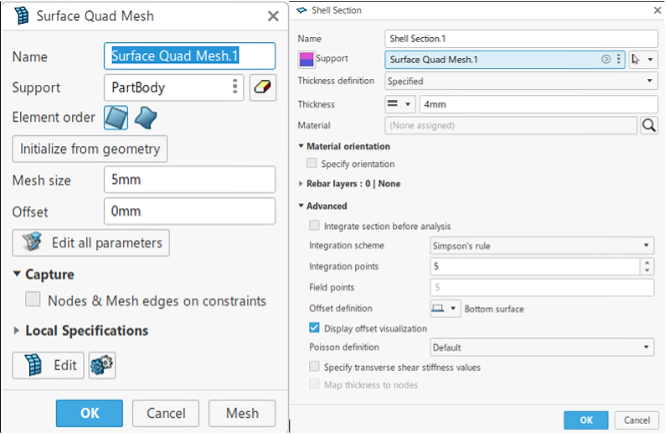
Figure 2- Mesh and shell properties definition
4. Analysis Setup — Buckling Eigenvalue
With the geometry, materials and mesh defined, the first analysis can now be created in Structural Scenario Creation app or Mechanical Scenario Creation app. An initial eigenvalue Buckling analysis to determine the first buckling mode shape, followed later by a nonlinear Static Riks analysis that uses the mode shape to introduce a geometric imperfection and capture the post-buckling response.
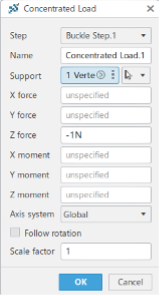
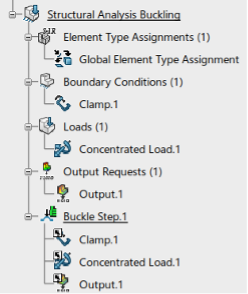
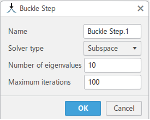
Figure 3 - Buckling analysis case setup
- Boundary Conditions & Loading - Buckling
For the buckling analysis there are three boundary conditions:
- Clamped end: All translational and rotational DOFs are constrained
- Loaded end: Concentrated compressive load of -1 N in the vertical direction used purely to extract the buckling mode shape and eigenvalue — not a real design load
- Loaded end: Fixed displacement in rotational and translational DOFs except vertical displacement (UZ)
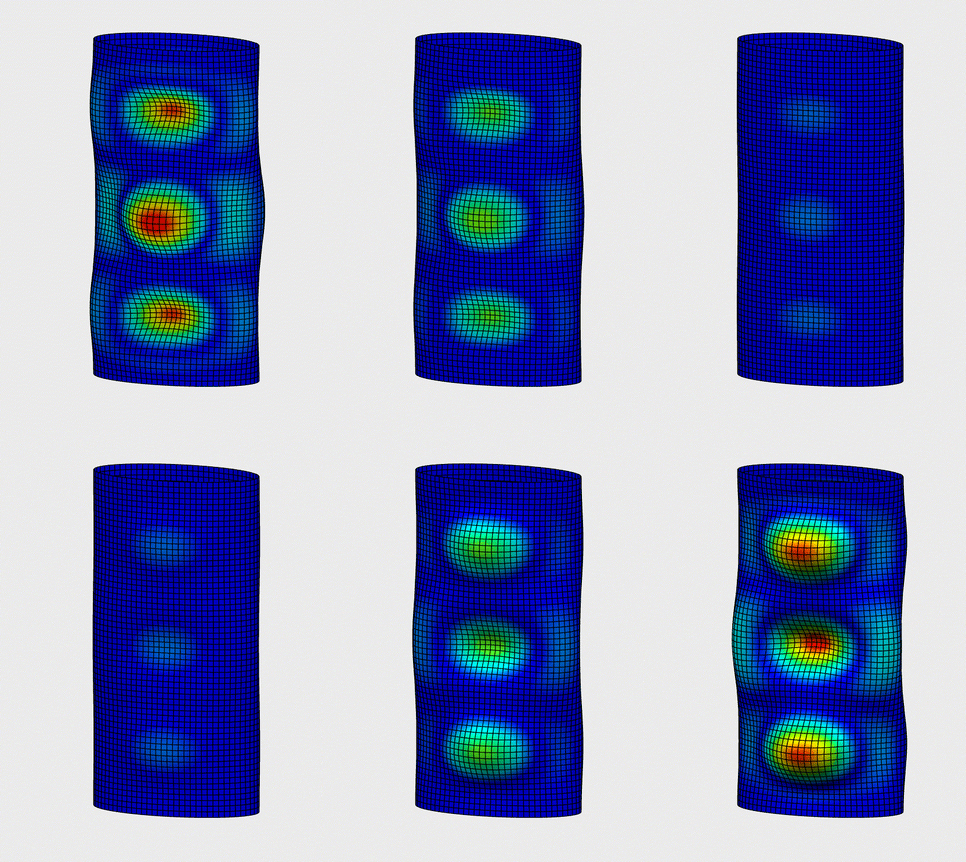
Figure 4 - Buckling analysis result for first 10 modes
5. Analysis Setup — Static Riks Method
For a shell structure under axial compression, when the critical load is reached, the structure loses its load-bearing capacity. Depending on the structural configuration and nonlinear response, the structure may exhibit stiffness degradation, snap-through, or a stable or unstable post-buckling response. Hence a new Analysis Case is required for the Static Riks simulation, which reuses the boundary conditions from the buckling step and introduces the geometric imperfection.
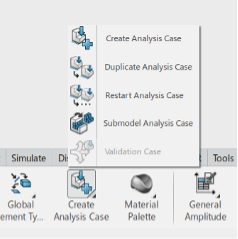
Figure 5 - Creating the Static Riks analysis case.
This simulation uses Static Riks Step procedure, which is an advanced arc-length algorithm; ideal to solve complex, geometrically nonlinear, or unstable structural collapse and post-buckling problems. Ensure in the advanced section the “Include geometric nonlinearity” is checked.
- Initial arc length: 0.1
- Maximum arc length: 0.5
- Minimum arc length: 0.00001
- Stopping criterion:
- Maximum axial displacement of top reference point = -7 mm
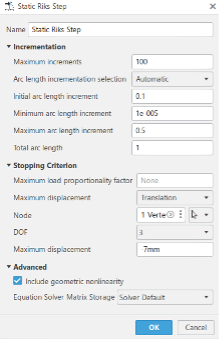
Figure 6 - Static Riks step definition, including arc length and stopping criterion.
In the Initial Conditions tab, the new imperfection command must be selected in order to introduce a small geometric imperfection in the model by using weighted mode shapes extracted in the previous step.

Figure 7 - Imperfection command
For the support, select the elliptical face and set the Step to Buckle Step. Next, select the appropriate mode number and an illustrative corresponding scale factor to introduce a realistic initial imperfection into the model.
- Mode Number: 1
- Scale Factor: 0.02
For this analysis, the lowest buckling mode was selected and assigned a scale factor, corresponding to 2% of the normalized unit length. Although small, this imperfection introduces a realistic deviation from the ideal geometry while remaining small compared with the 4 mm shell thickness. The imperfection should be consistent with the structural dimensions and manufacturing tolerances and ideally, should be based on the relevant engineering codes, standards, or design guidelines applicable to the specific structure and loading scenario.
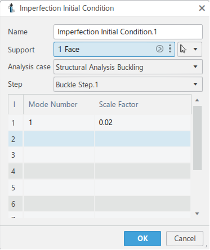
Figure 8 - Imperfection definition using the buckling mode shape
-
Boundary Conditions & Loading – Static Riks
For the static riks analysis there are three BC’s similar to buckling:
- Clamped end: All translational and rotational DOFs are constrained
- Loaded end: Concentrated load of -5.653e+006 N in the vertical direction
- Loaded end: Fixed displacement in rotational and translational DOFs except UZ
This value for concentrated load is chosen deliberately because it was the exact eigenvalue extracted for Mode 1 in the previous linear step. By setting the base Riks load equal to the theoretical linear buckling load, the Load Proportionality Factor (LPF) becomes perfectly normalized and will instantly reveal your structural knockdown factor.
After applying these boundary conditions and loading now the simulation is ready to run.
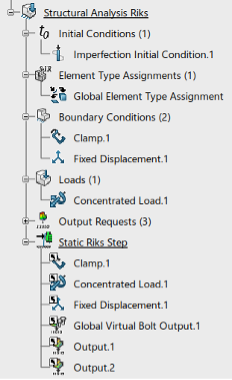
Figure 9 - Static Riks analysis case ready to run
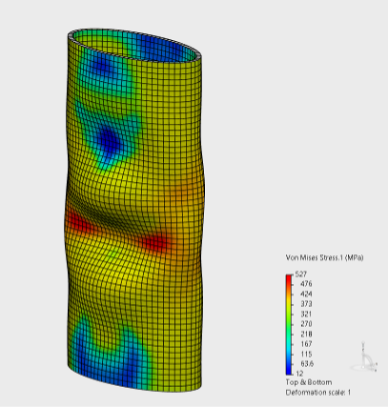
Figure 10 - Stress contour at Riks analysis displacement of -7 mm
Simulation Results
These results demonstrate the difference between the idealized linear buckling prediction and the response of the imperfect nonlinear structure. The nonlinear Static Riks analysis captures both the deformation response and the load–displacement behavior of the imperfect column.
Deformation and Stress Patterns
The simulation captures:
- Global buckling deformation
- Local shell buckling patterns
- Stress concentrations consistent with experimental observations
Force–Displacement Curve
Post-processing generates the reaction force–displacement curve shown below, plotting the axial actual reaction force at the bottom reference point against the applied axial displacement of reference point. The curve captures post-buckling softening behavior after the peak load is reached.
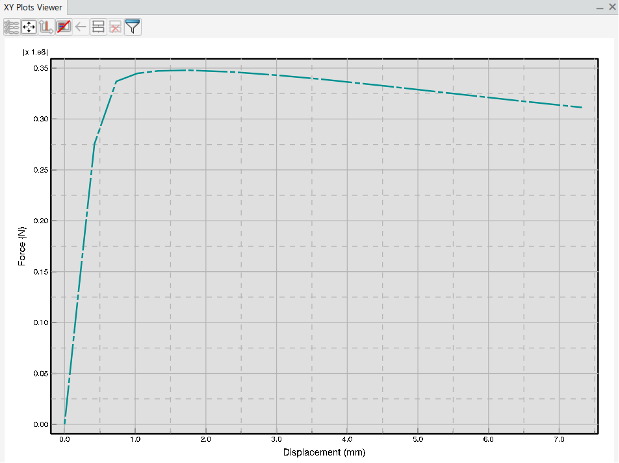
Figure 11 - Reaction force–Displacement Field curve from the Static Riks analysis
Load Proportionality Factor–Arc length Curve
Load Proportionality Factor (LPF)–Arc length curve is another important metric for evaluating the structural response of the system under incremental loading. LPF is a dimensionless scaling factor of reference load that determines the magnitude of the applied load at any given step in the analysis.
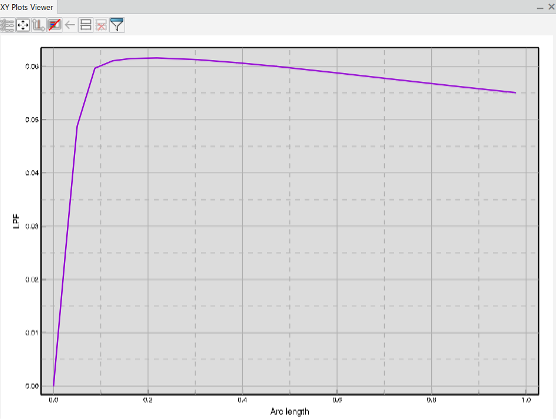
Figure 12 - LPF - Arc length History curve from Static Riks analysis
The peak value (maximum point) on the LPF vs. Arc Length curve represents the maximum load reached along the nonlinear equilibrium path for this specified imperfect system.
Key Takeaways
- 3DEXPERIENCE provides powerful nonlinear analysis capabilities, based on Abaqus technology.
- The interface and workflow differ substantially, requiring some learning.
- Static Riks analysis effectively captures buckling and post-buckling behavior.
- Kinematic coupling and shell modeling are critical for accuracy.
Final Thoughts
This blog post demonstrates that advanced nonlinear buckling analysis can be performed efficiently in 3DEXPERIENCE R2026x. While the modeling workflow differs from Abaqus/CAE, the underlying finite element methodology remains the same. By combining an eigenvalue buckling analysis with a Static Riks simulation, engineers can accurately predict nonlinear buckling behavior and post-buckling response within the 3DEXPERIENCE platform.